@veneficus:
import csv
import numpy as np
import matplotlib.pyplot as plt
def funkcja():
tabela = list(dane)
rok = []
srednie = []
for x in tabela:
rok.append(x[1].split('-')[0])
rok = sorted(set(rok))
for x in rok:
suma = 0
licznik = 0
for y in tabela:
if y[1].split('-')[0] == x:
suma += float(y[2])
licznik += 1
srednie.append(str(round(suma/licznik, 2)))
print('Srednia temperatura w ' , x , ' wynosila ' , str(round(suma/licznik,2)))
rok = np.array(rok)
srednie = np.array(srednie)
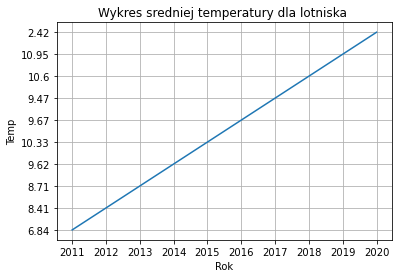
plt.plot(rok,srednie)
plt.title('Wykres sredniej temperatury dla lotniska ')
plt.xlabel('Rok')
plt.ylabel('Temp')
plt.grid()
plt.axis('tight')
plt.show()
return
while 1:
lotnisko = input('Wybierz lotnsko: ')
if lotnisko == 'Koniec' :
break
elif lotnisko == 'EPPO':
with open('EPPOm.txt', 'r', newline='') as eppo:
dane = csv.reader(eppo, delimiter = ',')
funkcja()
break
elif lotnisko == 'EPWA':
with open('EPWAm.txt', 'r', newline='') as epwa:
dane = csv.reader(epwa, delimiter = ',')
funkcja()
break
tu rekord z pliku csv 3 kolumna to temperatura
EPWA,2011-08-22 19:30,21.00,18.00,82.98,350.00,5.00