Ale juz ta niezoptymalizowana wersja jest lepsza od naiwnego podejscia
I mowie o tej niezoptymalizowanej bo taka mialem na mysli dolaczajac do tematu :)
naive.c
#include <stdio.h>
#include <limits.h>
#include <stdint.h>
uint64_t pop(uint64_t x);
int main() {
uint64_t t[10000];
for (int i = 0; i < 10000; i++) {
t[i] = pop(i);
}
return 0;
}
uint64_t pop(uint64_t x) {
uint64_t cnt = 0;
while (x > 0) {
    if (x & 1) cnt++;
    x >>= 1;
}
return cnt;
}
opt.c
#include <stdio.h>
#include <limits.h>
#include <stdint.h>
uint64_t pop(uint64_t x);
int main() {
uint64_t t[10000];
for (int i = 0; i < 10000; i++) {
t[i] = pop(i);
}
return 0;
}
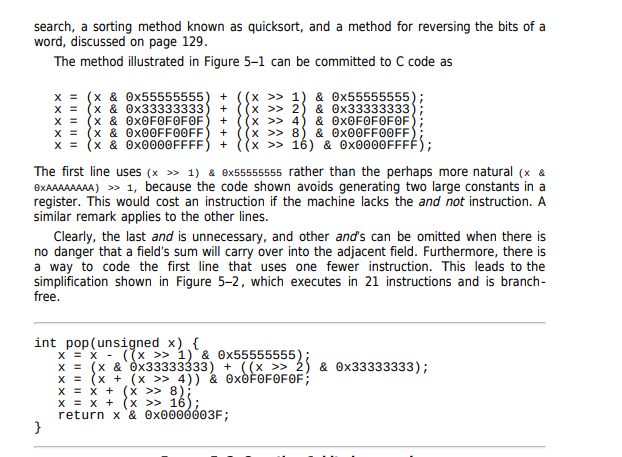
uint64_t pop(uint64_t x) {
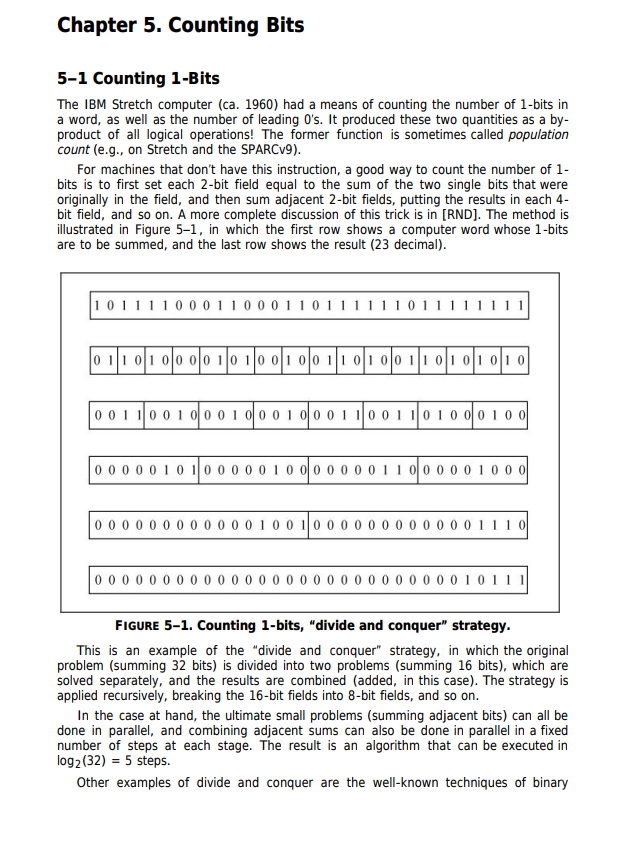
x = (x & 0x5555555555555555) + ((x >> 1) & 0x5555555555555555);
x = (x & 0x3333333333333333) + ((x >> 2) & 0x3333333333333333);
x = (x & 0x0F0F0F0F0F0F0F0F) + ((x >> 4) & 0x0F0F0F0F0F0F0F0F);
x = (x & 0x00FF00FF00FF00FF) + ((x >> 8) & 0x00FF00FF00FF00FF);
x = (x & 0x0000FFFF0000FFFF) + ((x >> 16) & 0x0000FFFF0000FFFF);
x = (x & 0x00000000FFFFFFFF) + ((x >> 32) & 0x00000000FFFFFFFF);
return x;
}
perf
stivens@S410UA ~/test $ gcc naive.c -o naive
stivens@S410UA ~/test $ gcc opt.c -o opt
stivens@S410UA ~/test $ sudo ./perf.sh ./opt

 Performance counter stats for './opt':

           454 394      cycles:u

             4 746      bus-cycles:u
           773 099      instructions:u            #    1,70  insn per cycle
            49 947      branches:u
             1 412      branch-misses:u           #    2,83% of all branches
             8 666      cache-references:u

       0,000816440 seconds time elapsed

       0,000882000 seconds user
       0,000000000 seconds sys


stivens@S410UA ~/test $ sudo ./perf.sh ./naive

 Performance counter stats for './naive':

           437 509      cycles:u                                                      (13,49%)
            25 305      bus-cycles:u
         1 233 026      instructions:u            #    2,82  insn per cycle
           317 181      branches:u
            54 966      branch-misses:u           #   17,33% of all branches
             8 711      cache-references:u


       0,001668939 seconds time elapsed

       0,001748000 seconds user
       0,000000000 seconds sys


stivens@S410UA ~/test $
Jak zniszczyc naive.c?
    for (int i = 0; i < 10000; i++) {
        t[i] = pop( UINT64_MAX - i);
    }
stivens@S410UA ~/test $ sudo ./perf.sh ./opt

 Performance counter stats for './opt':

           458 326      cycles:u
             4 788      bus-cycles:u
           783 098      instructions:u            #    1,71  insn per cycle
            49 946      branches:u
             1 376      branch-misses:u           #    2,75% of all branches
             8 468      cache-references:u


       0,000866206 seconds time elapsed

       0,000926000 seconds user
       0,000000000 seconds sys


stivens@S410UA ~/test $ sudo ./perf.sh ./naive

 Performance counter stats for './naive':

         6 024 886      cycles:u                                                      (47,35%)
            65 459      bus-cycles:u
         5 368 493      instructions:u            #    0,89  insn per cycle
         1 349 949      branches:u
            66 960      branch-misses:u           #    4,96% of all branches
             8 971      cache-references:u

       0,003396542 seconds time elapsed

       0,003393000 seconds user
       0,000000000 seconds sys